
ABSTRACT
Burden sharing has been one of the most hotly contested issues in NATO especially since the end of Cold War. Trump’s bitter statements about utility of the Alliance in the wake of his election and following urge by U.S. policy-makers to make Europe pay more for its own defence has added more fuel on fire. An important reason for rekindling this old debate is the great change in the security landscape NATO has to operate. NATO perceives multiple risks and threats of both conventional and non-conventional nature along its southern and eastern flanks, which will incur more costs on the Alliance. U.S. pushes Europe to stick to its pledge to spend 2% on defence 20% of which has to be allocated to major equipment acquisition. Germany on the other hand advocates creation of a sophisticated plan for implementation of such guidelines prioritising its national interests. The question we need to answer within this intense debate is, how does the Alliance financially adapt itself to the crises escalating in and around Euro-Atlantic region and how do EU and non-EU Allies share the burden?To answer these questions, we analysed defence spending behaviour of the Allies in the last four decades, each separated by milestones creating significant change in the Alliance modus operandi. In this regard, we arranged data in a dichotomous way, focusing on two main subsets, EU and non-EU Allies. We mapped which group contributed in what percentage in the Alliance budget to inform public debate about who shoulders the burden at what percentage and test the validity of the arguments. Then we matched the results of our expenditure analyses, narratives and global security landscape to find a middle ground. Our findings clearly illustrate a declining defence expenditure trend among NATO members for the last four decades only to be reversed with Ukraine Crisis. This has been true for EU Allies despite multiple crises preceding the latter. Non-EU NATO members (mainly U.S.) on the other hand have been more responsive to the risks and threats emanating around Euro-Atlantic region with regards to defence expenditure.
1. Introduction
The most recent rekindling of 2% debate was when the NATO Allies committed to devote 2% of their respective Gross Domestic Products (GDP) to defence spending during the Defence Ministerial in June 2006 (Press Briefing by NATO Spokesman, James Appathurai after the Meeting of the North Atlantic Council at the Level of Defence Ministers, 2006). At the Wales Summit in September 2014, the Allies further agreed to halt diminishing defence expenditures, a trend in full swing since the end of Cold War. According to the Summit Declaration, Allies conforming to the rule of spending a minimum of 2% of their respective GDPs on defence and/or 20% of their defence budgets on major equipment, including related Research & Development were to continue to do so. For the others not meeting any criteria, the declaration prescribed the way ahead as halting any decline in defence expenditure and aiming “to move towards the 2% guideline within a decade with a view to meeting their NATO capability targets and filling NATO’s capability shortfalls”. (Wales Summit Declaration, 2014).
The revival of 2% debate was primarily provoked by the deterioration in the general security situation around the globe. After the collapse of USSR, Allies had made remarkable cuts in their defence budgets since there was no credible conventional threat any more to challenge Europe. However, the outlook started to change starting from 9/11 attacks which provided a significant increase in U.S. Defence Expenditures, not influencing the trend for the rest of NATO members. For the latter, even Russian intervention in Georgia didn’t create necessary stimulus. The alarm bells rang for Europe only after Russian annexation of Crimea and extension of such move into two other Ukrainian regions in 2014. The level of alarm increased further with the emergence of Salafi jihadist terror in the Middle East and North Africa. In the current situation, NATO has to take measures against Russian provocative action along its Eastern borders and against the destabilizing effects emanating from Syrian civil war and proliferation of Salafi jihadist terrorist organizations along its Southern borders. Those measures or the posture NATO has to take in face of multiplicity of such threats certainly has its costs.
During his presidential election campaign, Trump severely criticized NATO, and even went so far as describing the organisation as “obsolete” (McCurry, 2016). The epicentre of the debate was Europe’s unwillingness to spend more for its own defence and its failing efforts to meet NATO’s 2% guideline (Funding NATO, 2017).
Despite such harsh criticism, Trump administration did not abstain from taking concrete steps to counter Moscow in defence of Allies (De Luce, Gramer, & Tamkin, 2018). For example, U.S. increased its posture in Europe by deploying rotational forces, to include an armoured brigade combat team and a combat aviation brigade. Additionally, U.S. provided battalion task force for NATO’s enhanced forward presence in Poland, pre-positioned equipment for additional Armoured Brigade Combat Team (ABCT), doubled maritime deployments to the Black Sea, executed bomber assurance and deterrence missions in Europe and, for the first time deployed fifth-generation fighters to Europe (House Armed Services Committee Hearing on Security Challenges in Europe, 2018). In the fiscal year 2018, U.S. Department of Defence requested nearly $ 4.8 bn for the European Reassurance Initiative (ERI), some $ 1.4 bn increase compared to that of 2017 (Pellerin, 2017). Furthermore, Secretary of Defence, Jim Mattis, during a joint press conference with NATO Secretary General Jens Stoltenberg in February 2017 stated: “the Alliance remains a fundamental bedrock for the United States.” Yet, U.S. continues and will continue to put constant pressure on Allies over this 2% guideline (Joint Press Statements , 2017).
Many experts and scholars has spilled ink and shared their assessments on the issue, in many cases taking sides. With the study at hand, our aim is to find answers to the question of how NATO financially adapts itself to the crises escalating in and around Euro-Atlantic region and how EU and non-EU Allies share the burden. We intend to inform public debate about the real substance of the current debate by delving deep into official figures given by NATO and SIPRI. We present a balanced view of the Ally defence spending, avoiding the extremes of dismissing European reluctance as avoidance from paying the costs of its own security or justifying U.S. insistence. We do argue that both the United States and Europe are less capable militarily in Europe (Techau, 2015) to counter contemporary threats and thus Europe’s defence is in jeopardy. Both sides are right in their arguments and the technical differences are to be discussed and solved on the table. In the final part, we dare to draw few conclusions and make policy recommendations.
2. Methodology
In our research we examined defence expenditure data of the Allies in four different periods, all of which constitute a historical milestone with implications on defence spending trends. Those periods are:
- 1980-1991, last decade of the Cold War,
- 1992-2001, from the immediate afterward of the Cold War till 9/11 terror attacks,
- 2000-2009, from the start of global war on terror until global financial crisis,
- 2010-2017, the last and the most recent epoch of the Alliance. As might have been realized, second and third periods are overlapping in that both periods have the years 2000 and 2001. The reason for that is to better monitor the devastating effects of 9/11 attacks on defence and security domain with further implications on defence expenditures.
In our effort to find explanations for general defence spending trends, we predicated our study upon global trends and omitted divergences in micro-trends such as the rivalry between Turkey and Greece not to bias our general findings.
Before further diving into the details, several clarifications should be made;
- France didn’t share her equipment expenditure data with NATO authorities until 1995. Thus, her GDP is not taken into account while calculating EU equipment expenditure ratios for the missing years.
- German defence expenditure for Berlin and occupation costs were not taken into consideration.[1]
- The “GDPs” and the “defence expenditures” of new NATO Members have been added according to respective membership years. This have a slight effect in years between 2004 and 2009, the years of enlargement of NATO to Eastern Europe.
- Based on the fact that Iceland does not possess standing armed forces, its defence expenditure data – if there is any – was neglected in NATO documents.
- The reader should be cognizant of the differing nature of the data that NATO and the World Bank provides. Despite being retrieved from the same sources, we came across inconsistencies within the reports. To be more precise, the five-yearly reports published pursuant to NATO Defence Planning Process (NDPP) reflect differences on yearly basis. So, based on the selection of the report year, slight differences may appear on different studies.
- For reasons of clarity, we used the NATO accredited term “defence expenditure” rather than “military expenditure”. “Equipment expenditure” includes major equipment expenditure and Research & Development devoted to major equipment as defined by NATO.[2] Some charts illustrate defence expenditure as quantity (in U.S. dollars), while some others as ratio. For the latter, we simply mean the ratio of the defence expenditure to the GDP of a given year. Equipment expenditures were only given as ratios, namely as the percentage of total defence expenditure.
- The open source data provided by NATO (Information on Defence Expenditures, 2018) and World Bank/SIPRI (Military Expenditure (% of GDP), 2018) databases have been used in the charts. NATO uses 2010 constant $ figures for defence expenditure data in its most recent papers. However, The World Bank, gives 2015 constant $ figures in its database. We used official NATO reports with 2010 constant $ figures where possible. For the rest, the World Bank data has been used.
- Reports released by NATO generally, if not always, reflect geographical perspective and divide data into two main categories; North Atlantic and Europe. This trend has been replaced by a division of U.S. and other Allies recently. Below is the latest chart from the Secretary General’s 2017 Annual Report, constituting another example.
- In order to tailor our findings according to our main audience, namely EU, we rearranged data and divided it into two new subsets: EU Allies and non – EU Allies, a departure from the current American-centric illustration.

Chart 1: Alliance GDP and Defence Expenditure Shares in 2017 (The Secretary General’s Annual Report 2017, 2018).
3. Defence Expenditure of Allies in Four Periods
a. The Last Decade of Cold War (1980 – 1991)
The last decade of Cold War witnessed a constant rise in defence expenditure of NATO members, though not proportional with respective growth in their GDPs. Soviet invasion of Afghanistan while increasing her defence expenditure caused a similar increase in the West with remarkable deterioration in relations with USSR.
This had further implications on figures. Although holding about 60% of total GDP of NATO-member states, the non – EU Allies’ defence expenditure made up roughly 70% of the total. (see Tables 1 and 2)
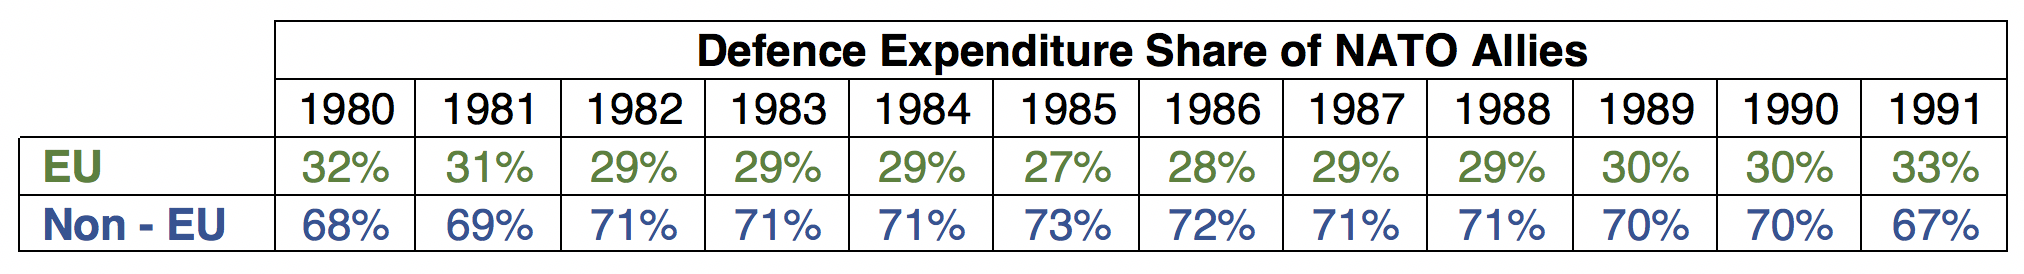
Table 1: Total Defence Expenditure Share of NATO Allies (1980 – 1991), Source: (SIPRI Military Expenditure Database).
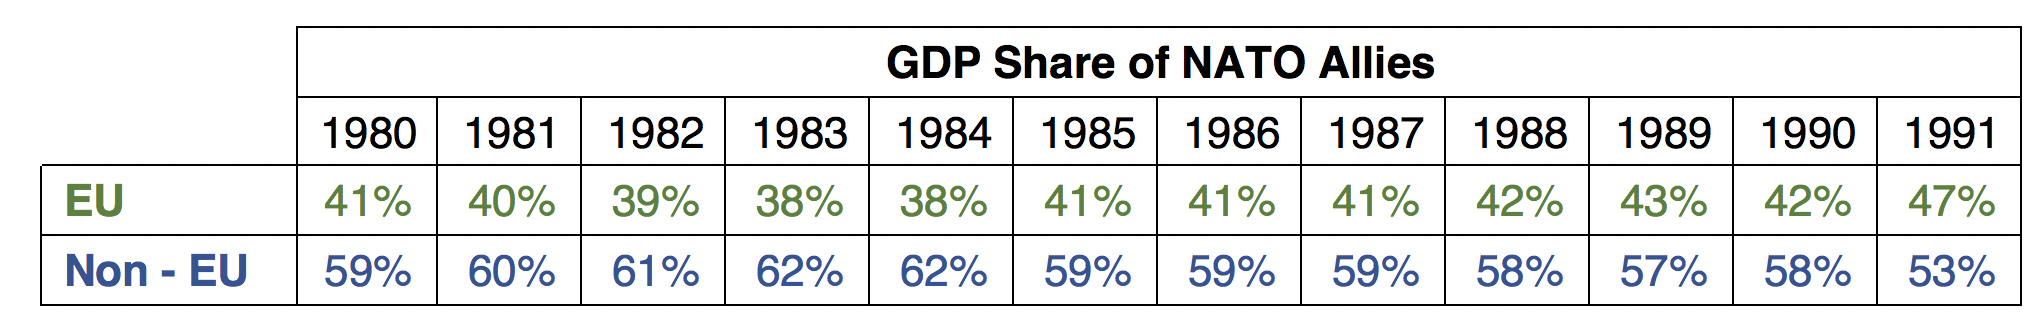
Table 2: Total Equipment Expenditure Share of NATO Allies (1980 – 1991), Sources: (Information on Defence Expenditures, 2018), (SIPRI Military Expenditure Database).
Except for 1991, as a whole group, EU Allies kept their defence expenditure ratios above 3% minimum except for 1990 [2.93%] and 1991 [2.74%], the year USSR dissolved. This became true although at declining percentages (see Chart 3, green line). Individually, except for Luxembourg, all Allies kept their defence spending above 2% individually throughout the period (in those days the NATO guideline was 3%). Non – EU Allies though, exposed to various risks and threats kept their defence expenditures well above 5% (chart 3, blue line). Of course, figures belonging to U.S., a giant Ally, dominate the entire chart.
From the perspective of equipment expenditure, except for U.S., UK and to a certain extent Netherlands, Norway, Canada, Greece and Turkey, Allies couldn’t exceed 20% guideline (see Chart 3, blue bars for non-EU, green bars for EU Allies). As a whole, non – EU Allies conformed to 20% guideline (thanks to the U.S.) while EU Allies fell as low as 15% especially in 1991. As we will witness in the following period, the collapse of the USSR directly affected the defence expenditures and sharp declines were observed.
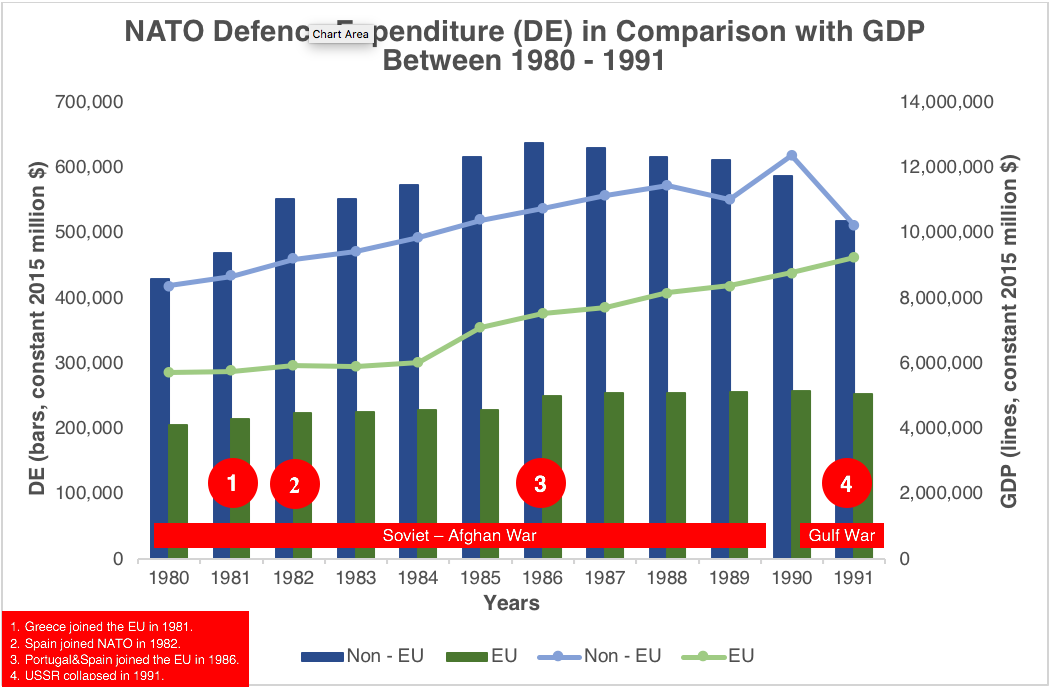
Chart 2: NATO Defence Expenditure in Comparison with GDP between 1980 – 1991 Sources: (Information on Defence Expenditures, 2018), (SIPRI Military Expenditure Database)
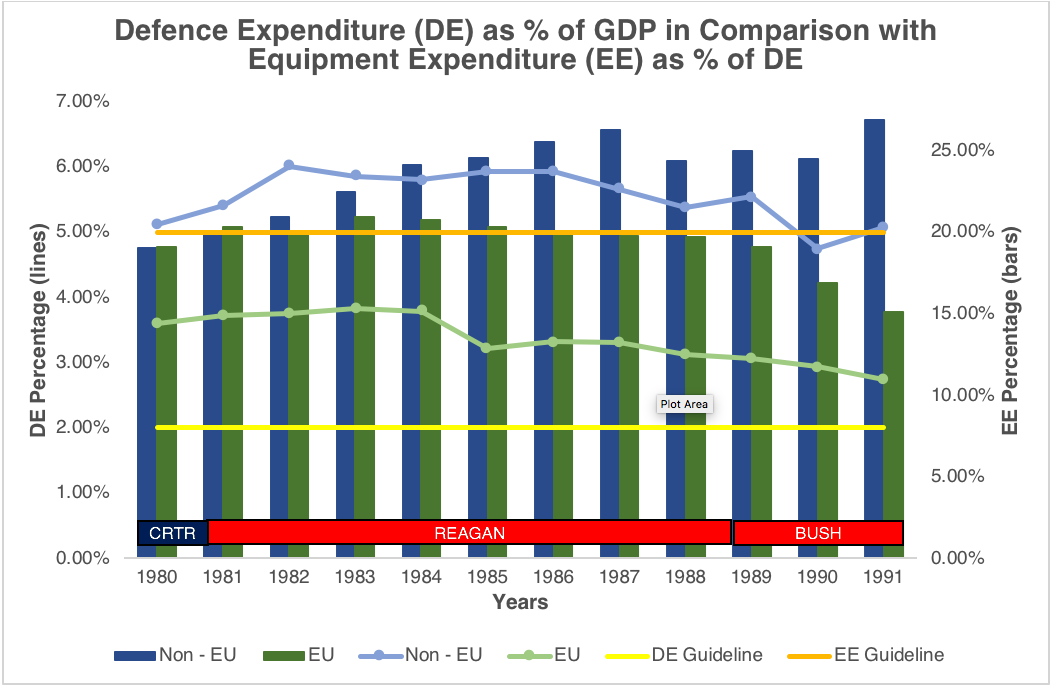
Chart 3: Defence Expenditure as % of GDP in Comparison with Equipment Expenditure as % of DE between 1980 – 1991 Sources: (Information on Defence Expenditures, 2018), (SIPRI Military Expenditure Database).
b. Post-Cold War (1992 – 2001)
In the period between the collapse of the Soviet Union and 9/11 attacks, NATO members’ GDPs rose, while their defence budgets fell at a constant rate till Kosovo War. NATO member states and especially EU Allies benefited much from the cuts in defence spending, which has been often dubbed as peace dividend (Gupta, Clements, Bhattacharya, & Chakravarti, 2002). This was an outcome of absence of any credible conventional threat anymore to challenge themselves or NATO.
However, the deterioration of the security situation in Western Balkans caused a bounce back for European defence expenditure. The bloodshed in Bosnia and NATO’s direct involvement in the Kosovo War caused a steady growth in Allies’ defence budgets (see Chart 4). As GDP share of the non – EU Allies rose, so did their defence expenditures. (See Tables 3 and 4)
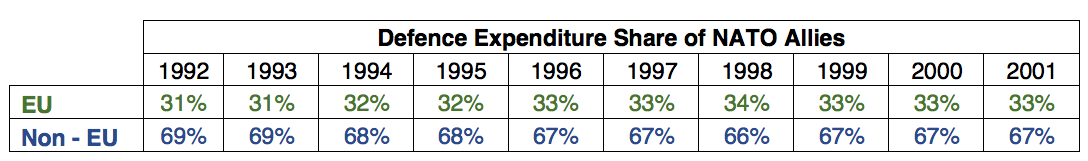
Table 3: Total Defence Expenditure Share of NATO Allies (1992 – 2001), Source: (SIPRI Military Expenditure Database).
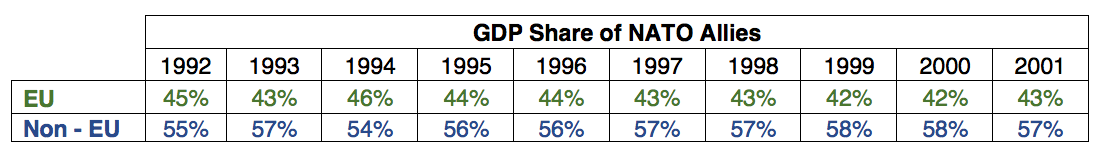
Table 4: Total Equipment Expenditure Share of NATO Allies (1992 – 2001), Sources: (Information on Defence Expenditures, 2018), (SIPRI Military Expenditure Database).
When it comes to the defence expenditure/GDP ratio, the figures for both EU and non – EU Allies show dramatic falls when compared to the previous period, though at different rates. The ratios for non-EU Allies follow a constant fall from 4.9% (1992) to 2.86% (2001). EU Allies, on the other hand, follow a rather cautious behaviour about their spending, arguably due to aforementioned conflicts between ex-Yugoslavian states. Their respective ratios follow a steady fall from 2.61% (1992) to 1.89% (2001) (see Chart 5, blue line for non-EU, green line for EU Allies). As a group, EU Allies fall below 2% threshold after 1997.
Similar to the previous period, equipment expenditure percentages of the EU Allies were consistently below 20% threshold (see Chart 5, green bars) while non – EU Allies never fell below that threshold (see Chart 5, blue bars).
States like the Czech Republic, Hungary and Poland that attained membership in this period had little effect on the overall defence expenditure of the Alliance. But the political impact of their membership was huge, and their NATO membership paved the way for their EU membership in the coming years.
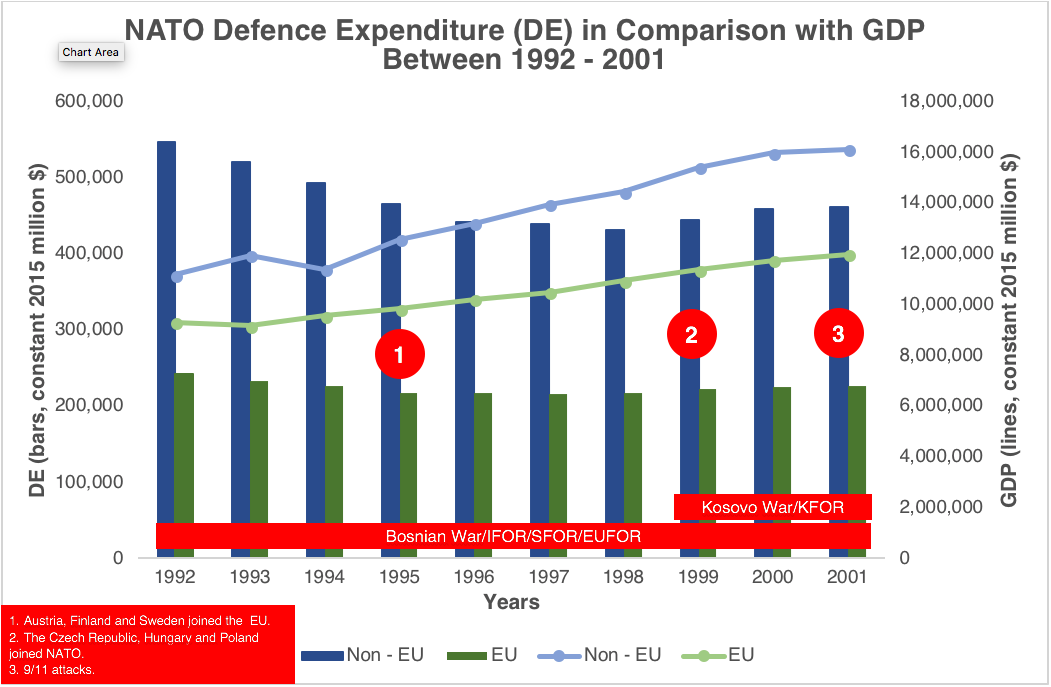
Chart 4: NATO Defence Expenditure in Comparison with GDP between 1992 – 2001 Sources: (Information on Defence Expenditures, 2018), (SIPRI Military Expenditure Database).
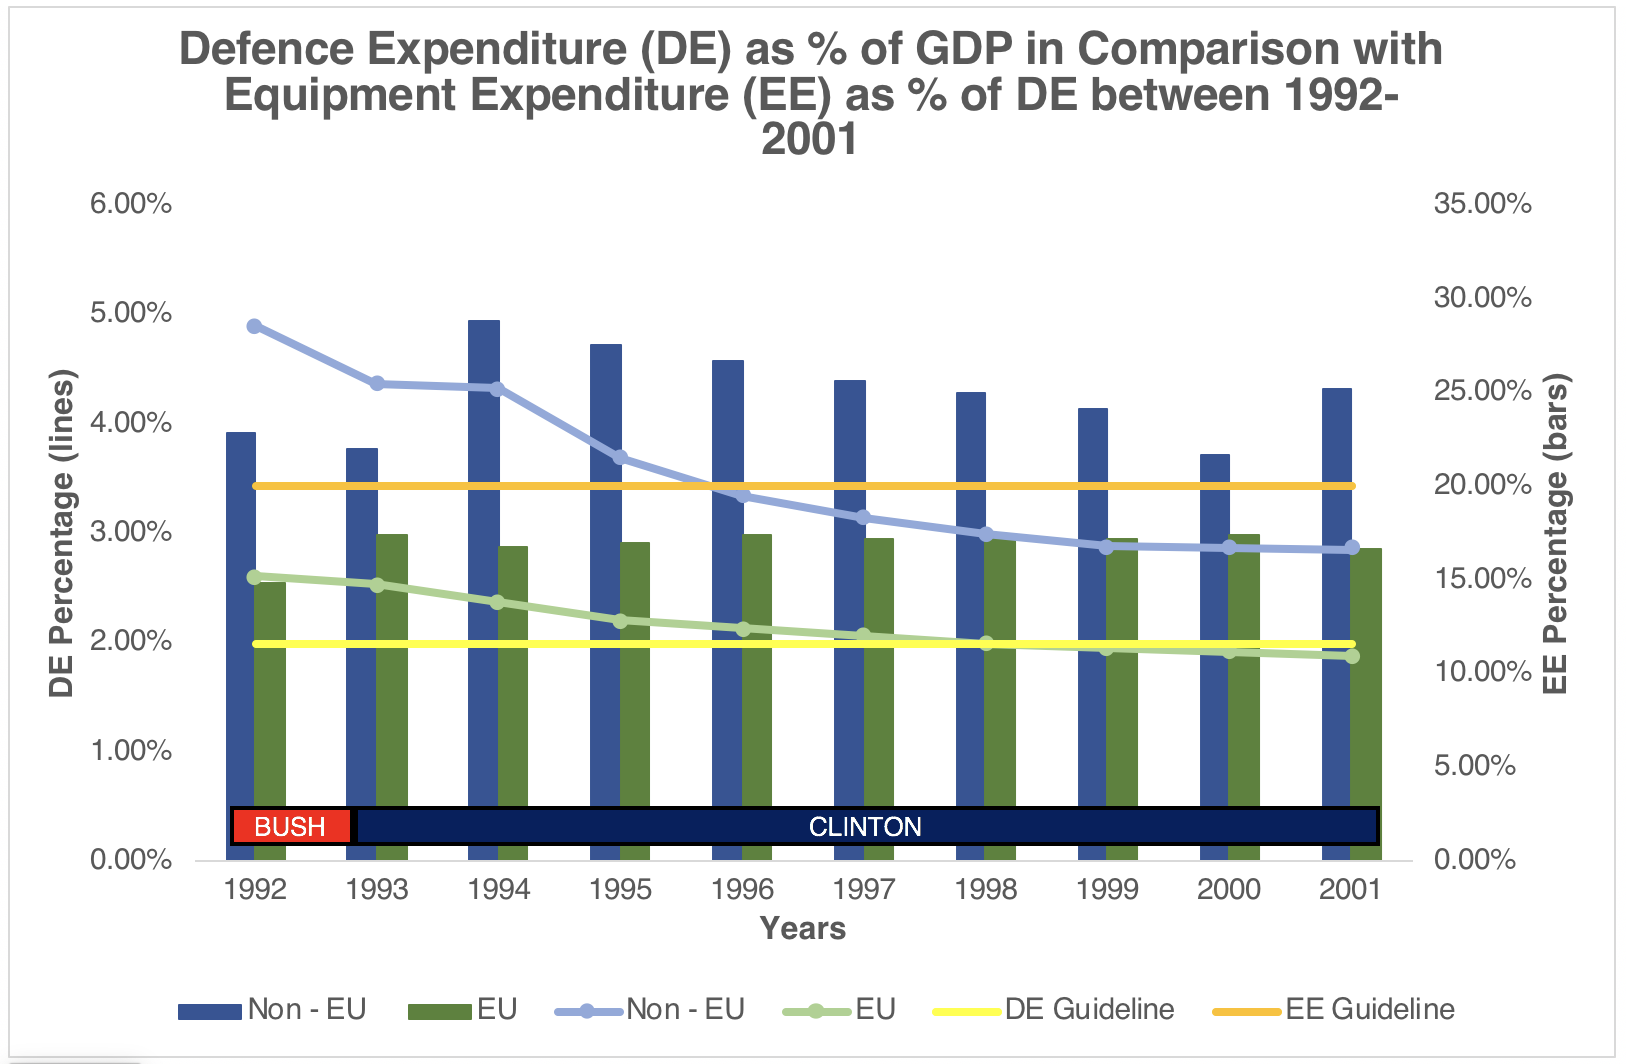
Chart 5: Defence Expenditure as % of GDP in Comparison with Equipment Expenditure as % of DE between 1992 – 2001 Sources: (Information on Defence Expenditures, 2018), (SIPRI Military Expenditure Database)
c. War on Terror (2001 – 2009)
Both EU and NATO had their largest enlargement wave during this period. The expansion was towards eastern strategic direction, namely Eastern Europe and Balkans or former Russian “sphere of influence”.
This period also witnessed the “operationalization of NATO”. In line with U.S.- led war on terror, NATO engaged in the fight in Afghanistan while continuing its existence in the Western Balkans. Although NATO handed over much of its responsibilities to EUFOR in Bosnia and Herzegovina, burden on the NATO nations remained almost unchanged.
GDP share for the period remained almost constant for both groups. From defence expenditure perspective however, non-EU Allies’ share constantly increased from 66% in 2000 to 75% in 2009, whereas those of EU Allies decreased from 34% in 2000 to 25% in 2009. (see Tables 5 and 6)
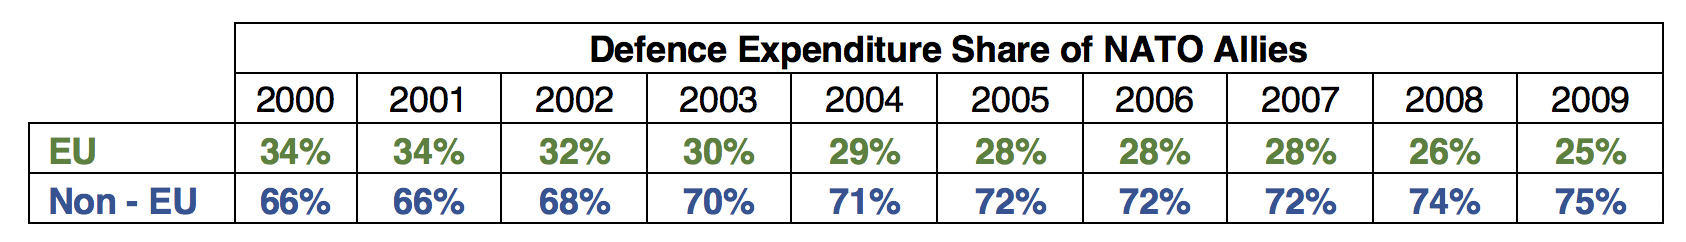
Table 5: Total Defence Expenditure Share of NATO Allies (2000 – 2009), Source: (SIPRI Military Expenditure Database)
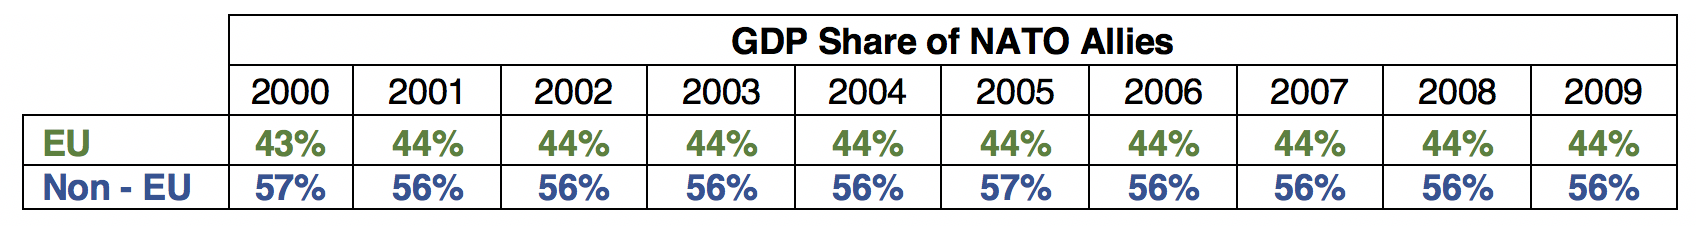
Table 6: Total Equipment Expenditure Share of NATO Allies (2000 – 2009), Sources: (Information on Defence Expenditures, 2018), (SIPRI Military Expenditure Database)
The reasons for such inverse movement between the two groups can be attributed to 9/11 attacks and following actions by U.S. and the Coalition in Afghanistan and Iraq. The two campaigns had enormous effect on defence expenditures of the U.S. between 2001-2009. U.S. defence expenditure increased by 50% in less than a decade when compared to the other sector expenditures, increasing on average about 13.5%. Over the same period, defence expenditure of non-EU members on average increased from 2.38% of their respective GDPs to 2.58% while that of EU members decreased from 1.81% to 1.64%. For the latter, slight increase in defence expenditure ratio in 2009 was caused by the decline in GDPs due to 2008 global economic crisis. Russian intervention in Georgia in 2008 wasn’t perceived as a threat enough to increase defence budget neither by EU nor by non-EU members. Unlike EU Allies, non-EU Allies satisfied the 20% equipment expenditure guideline as a whole. (see Chart 7, blue and green bars)
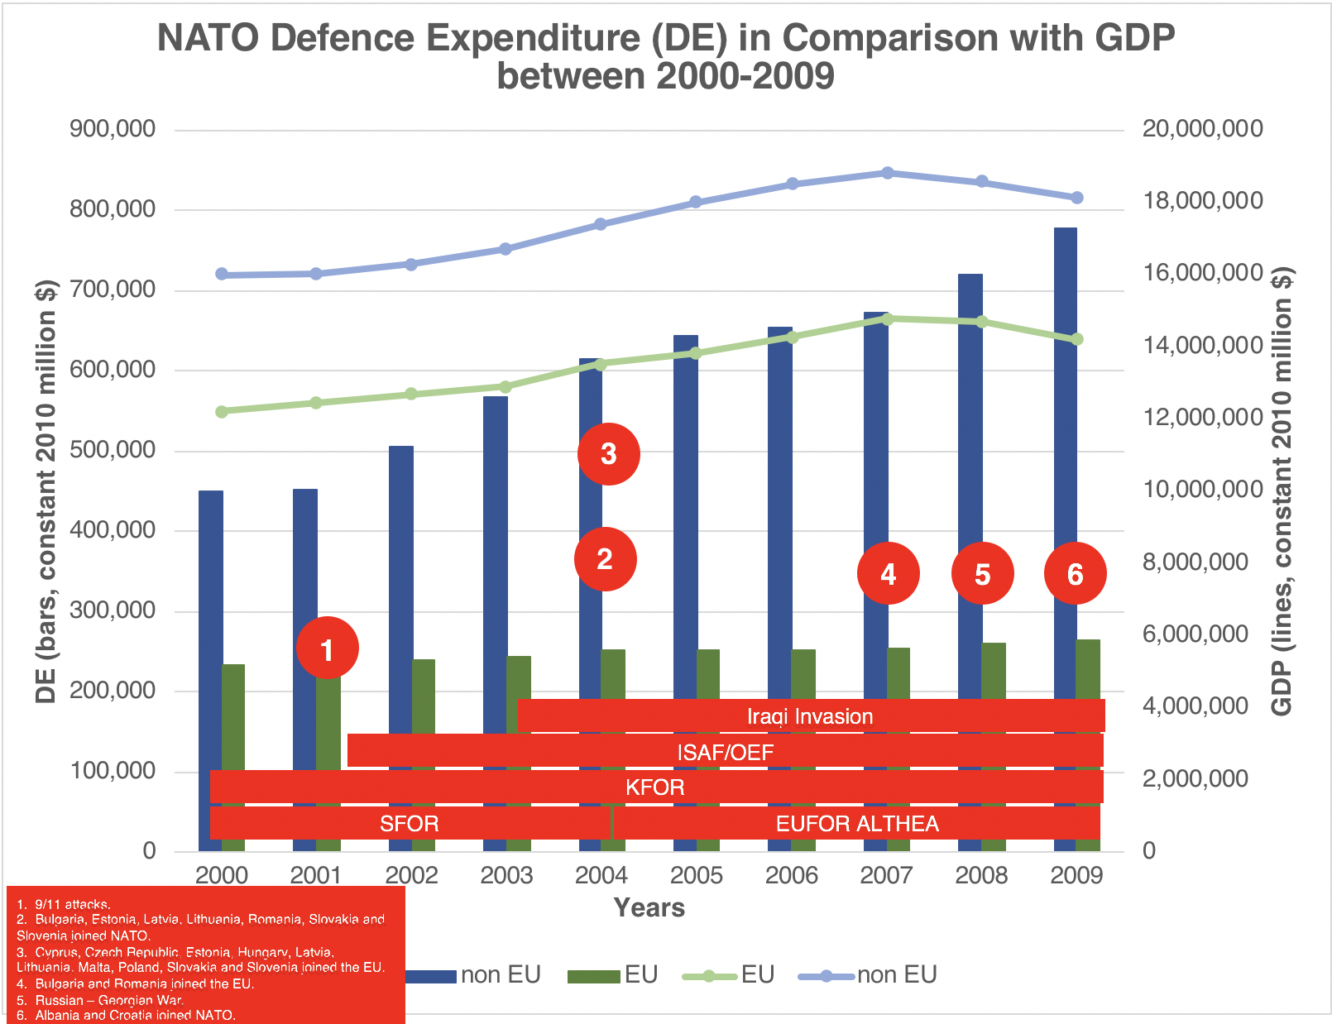
Chart 6: NATO Defence Expenditure in Comparison with GDP between 2000 – 2009 Sources: (Information on Defence Expenditures, 2018), (SIPRI Military Expenditure Database)
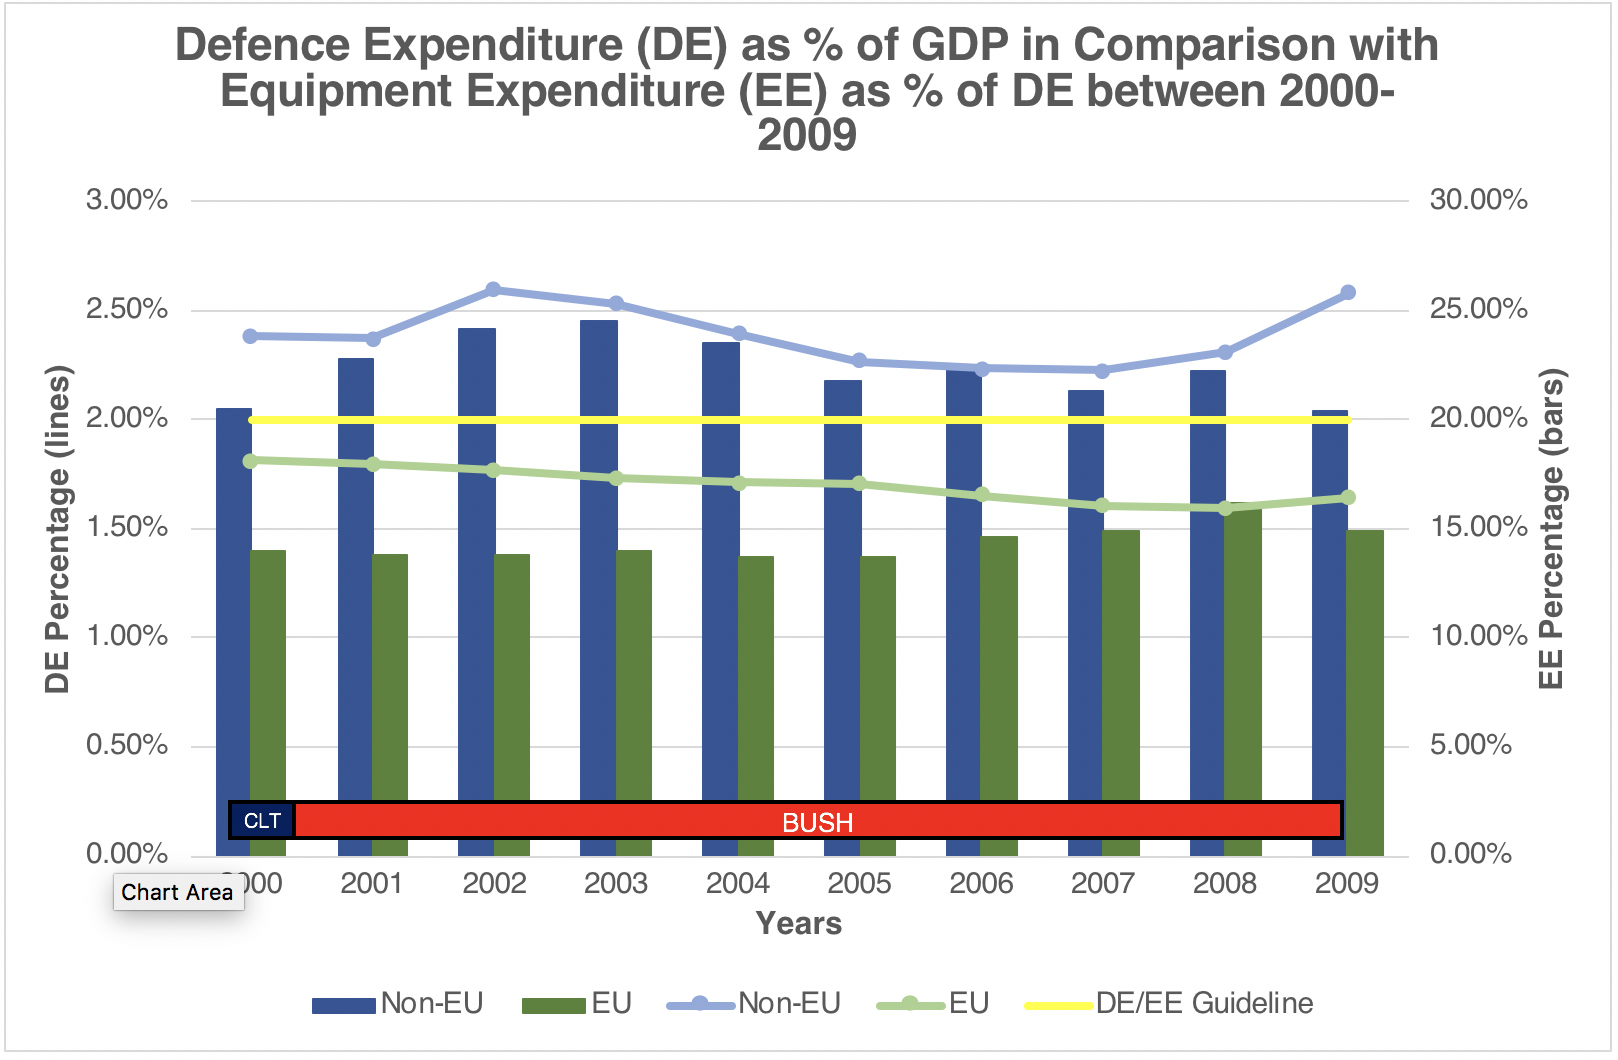
Chart 7: Defence Expenditure as % of GDP in Comparison with Equipment Expenditure as % of DE between 2000 – 2009 Sources: (Information on Defence Expenditures, 2018), (SIPRI Military Expenditure Database)
d. MENA Challenges and Cold War 2.0 (2010-2017)
Latest decade witnessed a rupture in international order. Euro-Atlantic region faced multiple threats of both conventional and non-conventional nature emanating from eastern and southern flanks. Events triggered by Arab Spring had disastrous effects for populations in the region and its effects spilled over Europe as well. Russia, having learned valuable lessons from Russian – Georgian War, responded to Western enlargement to Ukraine by illegal annexation of Crimea and occupation of Donbass region. In line with its Middle East strategy, Russia intervened in the fight in the Levant when it saw that its footprint was diminishing as the Ba’ath regimes fell one by one.
In the south, U.S., NATO and EU responded to the developments first with Operation Unified Protector (OUP) in Libya then with Operation Inherent Resolve (OIR) in Syria and Iraq against Daesh.
In the east, NATO both adapted to the new challenges and (re)assured its eastern Allies with a couple of measures most notably with Enhanced Forward Presence (eFP). For some, Cold War 2.0 has commenced (Wintour, Harding, & Borger, 2016). New engagements have relatively decreased the importance of ongoing operations. For example, in 2012 there were more than 130,000 troops deployed in ISAF theatre (International Security Assistance Force (ISAF): Key Facts and Figures, 2012). The biggest operation in NATO history shrank into a train, advise and assist mission (Resolute Support Mission, RSM) with merely 13,000 troops (Resolute Support Mission (RSM): Key Facts and Figures, 2015) in non-combat roles in less than 3 years. Relatively stable situation in the Western Balkans provided economy of power for NATO, however it couldn’t disengage from the region since Western Balkans has a potential to be a front in the struggles both against Daesh and Russia. Successor states of Yugoslavia, including Serbia are either too weak or too reluctant to resist Russian influence and/or extremism. These tremendous changes in the security landscape caused great turbulence in the defence expenditure of the Alliance.
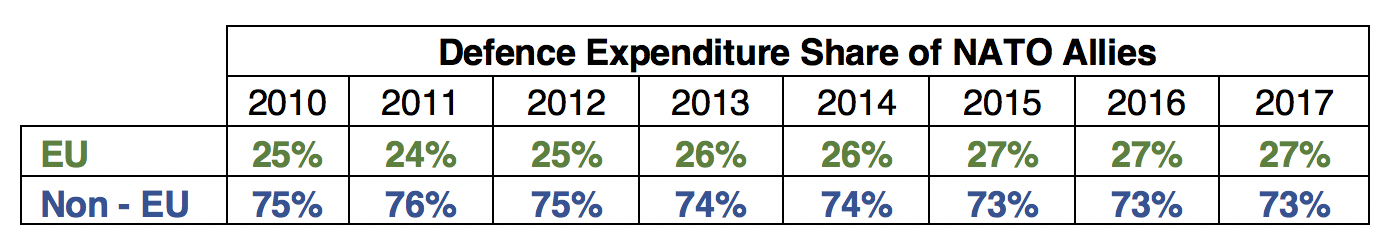
Table 7: Total Defence Expenditure Share of NATO Allies (2010 – 2017), Source: (SIPRI Military Expenditure Database).
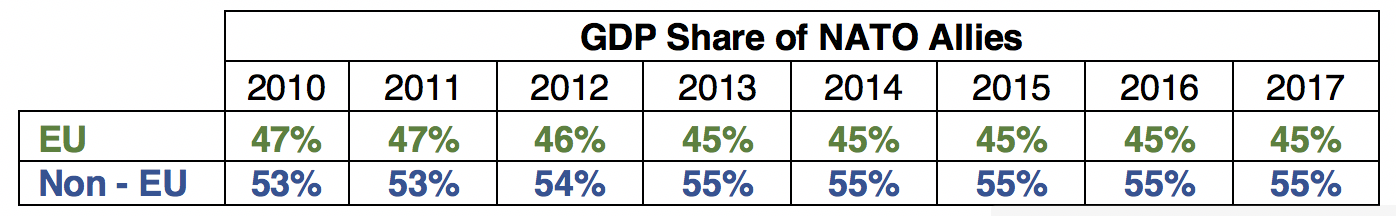
Table 8: Total Equipment Expenditure Share of NATO Allies (2010 – 2017), Sources: (Information on Defence Expenditures, 2018), (SIPRI Military Expenditure Database)
Reverting back to the statistics, when compared to the previous period, GDP share between EU and non-EU members remained unchanged. However, starting from 2015, EU defence expenditure share increased due to the Russian aggression. (see Tables 7 and 8) Downwards trend in defence expenditures veered in an opposite direction when Russia intervened in Ukraine (chart 8, blue and green bars). This shift in trend can also be observed in defence and equipment expenditure ratios of both EU and non – EU nations (chart 9).
Although nations raised their defence spending, except U.S., UK and Greece (from 2015 on Estonia and Poland) they still fell short of 2% threshold. Estonia and Poland met 2% requirement starting from 2015, a direct consequence of unrest in Ukraine in 2014. It is arguable that Russia’s irredentist policies put an end to long lasting stagflation in defence sector in some allies.
For EU, Ukraine Crisis put an end to the decrease in defence expenditures in 2015 and further reversed it to reach 2.8% although rate of GDP increase was only 1.7% compared to previous year. It can be deduced that EU members couldn’t get over the deleterious effects of 2008 Global Crisis as non-EU members.
As for the equipment expenditure ratios, as a whole, non-EU NATO members either met or approached to 20% threshold in this period. However, EU members have only been close to touch the line in 2017 with 19.13% on average (see Chart 9 blue and green bars respectively).
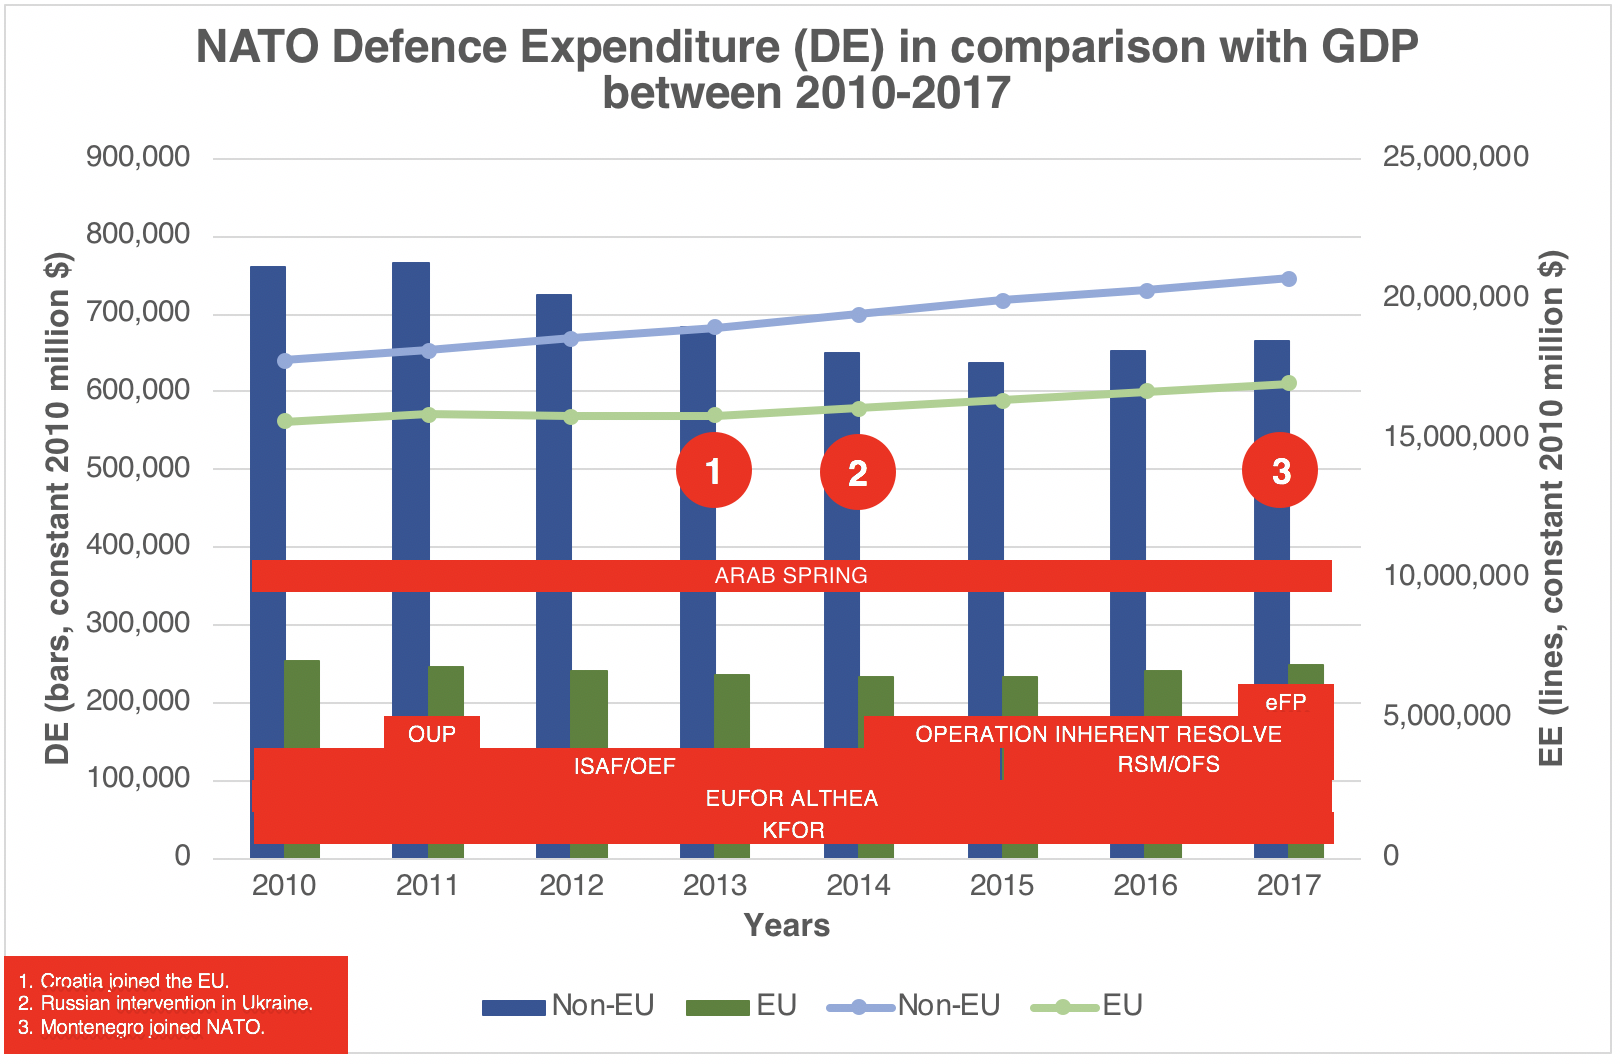
Chart 8: NATO Defence Expenditure in Comparison with GDP between 2010 – 2017 Sources: (Information on Defence Expenditures, 2018), (SIPRI Military Expenditure Database).
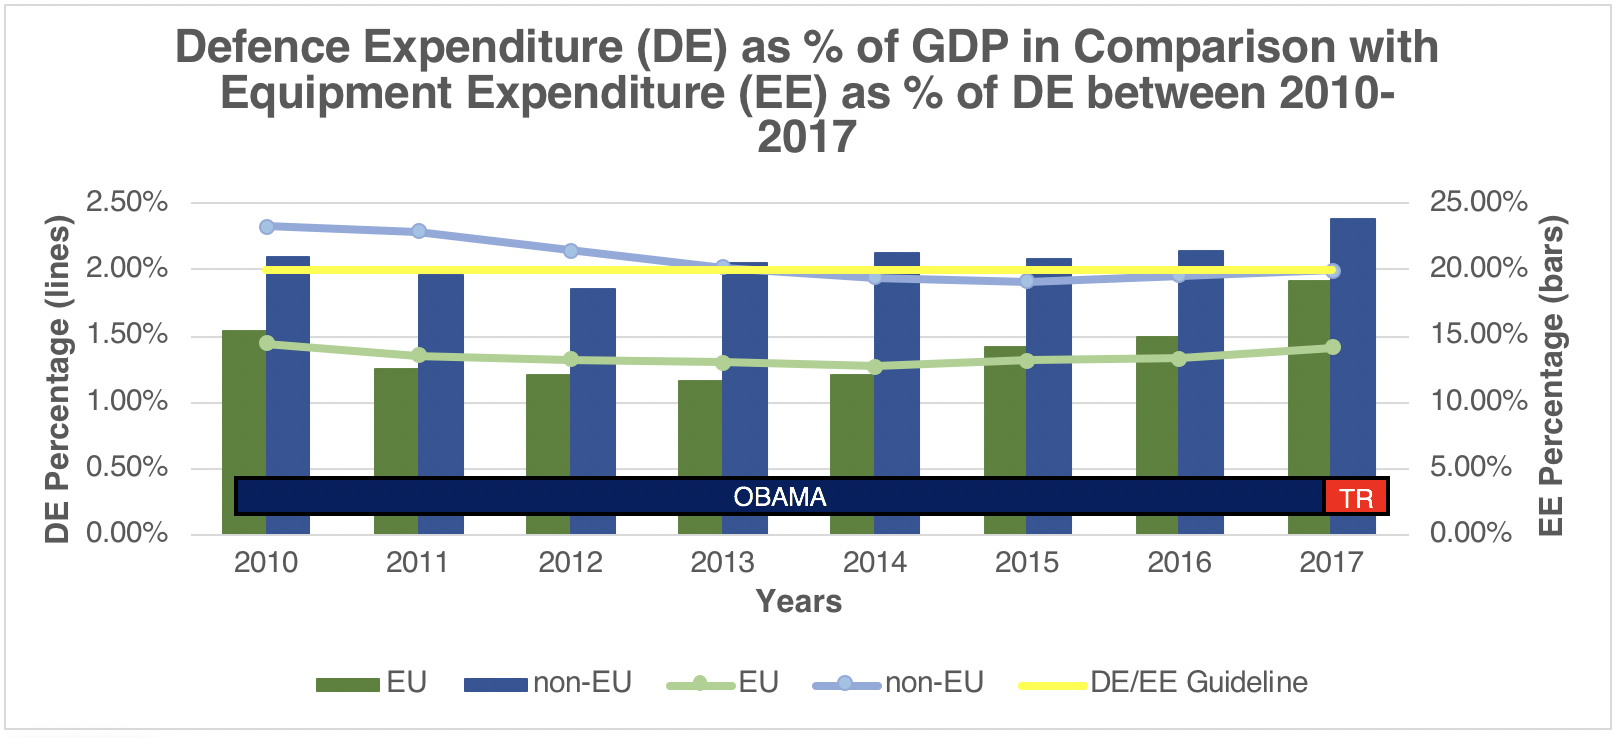
Chart 9: Defence Expenditure as % of GDP in Comparison with Equipment Expenditure as % of DE between 2010 – 2017 Sources: (Information on Defence Expenditures, 2018), (SIPRI Military Expenditure Database)
Russian intervention in Ukraine caused a change in threat perception especially in Eastern Flank of NATO. While half of those members’ (bordering Russia) defence expenditure was below 1% of their GDP in 2014 and for the rest below 2%, nearly half of the group’s defence expenditure met the 2% target in 2017 (chart 10).
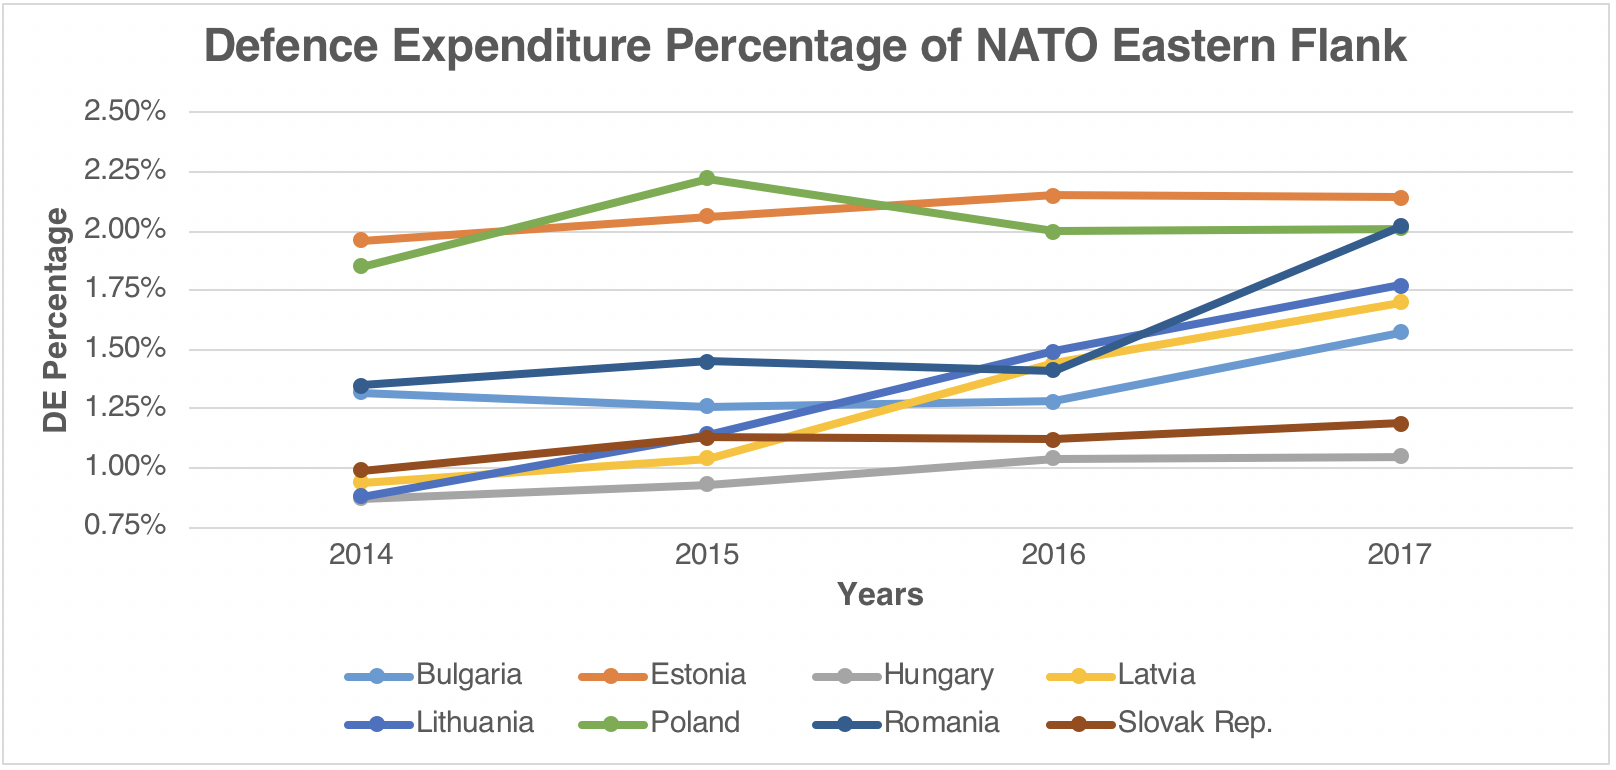
Chart 10: Defence Expenditure Percentage of NATO’s Eastern Flank Nations After Russian Intervention in Ukraine.
When we look at the overall defence expenditure ratios of last four decades, a constant fall especially after the Cold War is observed (Chart 11). However, non-EU NATO members, especially U.S. seem much more responsive to the risks and threats emanating around Euro-Atlantic region. Decline in EU member NATO nations’ defence expenditure ratios would only be stopped by the Ukraine Crisis.
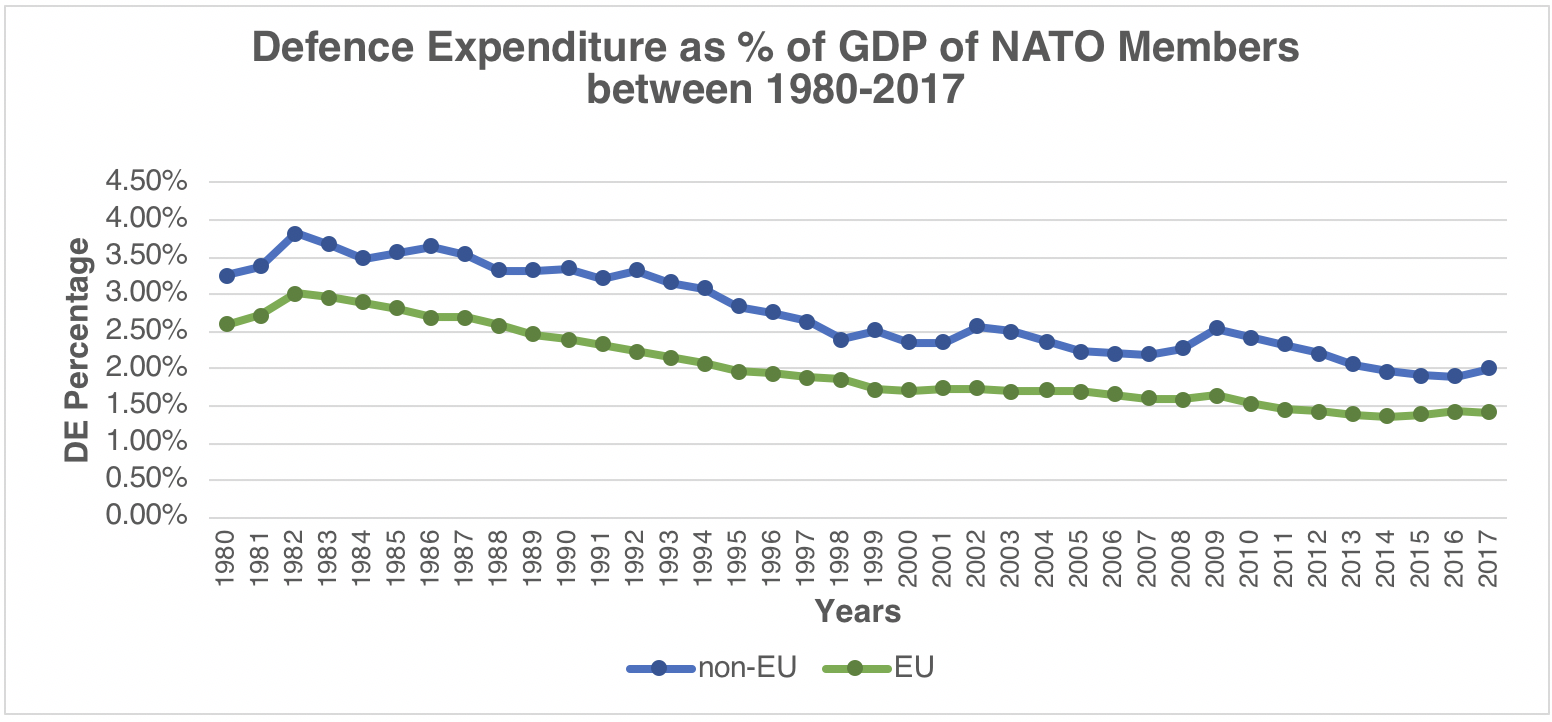
Chart 11: Defence Expenditure Percentage of GDP of NATO Members Between 1980 and 2017, Sources: (Information on Defence Expenditures, 2018), (SIPRI Military Expenditure Database)
4. What would happen if 2% and 20% targets could have been reached?
NATO Guideline for members since 2006 has been spending 2% of their GDPs in defence and 20% of their defence budgets on major equipment. The latter refers to major equipment procurement as money spent on missile systems, missiles (conventional weapons), nuclear weapons, aircraft, artillery, combat vehicles, engineering equipment, weapons and small arms, transport vehicles, ships and harbour craft and electronic and communications equipment. Even though 2% is not a perfect tool to measure contribution to collective defence, it is useful for members to set a target to reach. The difference between targeted and actual defence expenditure was $ 89 bn in 2010 and the annual gap reached to the level of $ 121 bn in 2016. If all NATO Members would have satisfied 2% threshold, they would have spent $ 769 bn more on defence between 2010-2016. $ 219 bn of this amount was supposed to be on equipment expenditure. If this additional amount had been spent on equipment, it could mean a more self-sufficient Europe in defence, more contribution to NATO missions, less need of support from U.S. in deterrence and defence of European defence and more arms import from U.S.
Arms import by EU Allies between 2010-2016 was $ 22 bn and the $ 11 bn of that came from U.S. This became true even though 5 of the 8 largest arms importers are EU member states. Possible increase in defence equipment expenditure of NATO Members would possibly increase arms export of U.S., even though the amount would still be nearly negligible when compared to the total of American arms sales figures.
5. Positions of U.S. and Germany in 2% Debate (General Policy Statements)
Both inspired by Roosevelt, Obama was speaking softly while Trump is carrying a big stick. Regardless of the changing tides of daily politics in the U.S. and idiosyncratic statements of late president Trump, National Security Strategy explicitly indicates that U.S. is ready for (un)conditional support to its NATO Allies (National Security Strategy of the United States of America, 2017). The strategy reads: “The United States remains firmly committed to its European allies and partners as well as Article V of the Washington Treaty.” The U.S. sees NATO as a cornerstone in its multilateral approach to global security and a precious tool to maintain superiority over its competitors. So far unfaltering U.S. contribution to NATO efforts and budget is a testimony for that.
Yet, American policymakers don’t shy away from reminding their Allies to assume greater responsibility for their own defence and pay their fair share to protect mutual interests, values and Western way of life. They repeat: ‘The United States fulfils our defense responsibilities and expects others to do the same.’ (National Security Strategy of the United States of America, 2017).
Rose Gottemoeller, a U.S. diplomat and first ever female Deputy Secretary General in the history of NATO continuously stresses the need for complementarity between NATO and EU efforts (NATO Deputy Secretary General Discusses Transatlantic Partnership at Brussels Forum, 2018). Similar concerns were raised by U.S. Permanent Representative to NATO Kay Bailey Hutchinson about possible protectionist behaviour of European Allies in defence sector (Erlanger, 2018).
As one of the major players in this debate, German Minister of Defence Ursula Von der Leyen found U.S. calls on boosting up defence expenditures as ‘a fair demand’ (US Request for NATO Spending Boost ‘a Fair Demand,’ German Defense Minister Says, 2017). However, Germany has two caveats. First, Germany continually emphasizes the importance of the EU as a partner for NATO. Second, It questions the added value of the defence expenditures.
Germany recognises its duty and responsibility to contribute to collective defence through strengthening the cohesion and capacity of NATO and the EU. To that end, Germany gives priority to strengthening NATO’s European pillar, by interlinking and integrating European armed forces and coherent interaction between NATO and the EU.
According to the German Security Policy, The German Government is determined to spend 2% of its GDP on defence and invest 20% of this amount in major equipment over the long term and subject to available resources in order to meet the target set by NATO. However, It also works towards shifting the focus in NATO more towards the relationship between expenditure and performance. Germany questions how nationally invested funds contribute to strengthening NATO capabilities. In this respect, Germany uses Framework Nations Concept to strengthen NATO’s European pillar (White Paper 2016 on German Security Policy and the Future of the Bundeswehr, 2016).
In line with the security policy, European Defence Report, published prior to Munich Security Conference 2018 argues that countries that spend most on defence are not necessarily those that make the most significant contributions to European or Allied security. Some may spend more than 2% of their GDP on defence but make only minor contributions to the Alliance as a whole and seldom show up for NATO or EU missions. Other countries fall short of the 2% goal while providing crucial capabilities to joint missions or by regularly committing troops to common operations (European Defence Report, 2017).
The issue was further expanded upon within Munich Security Report 2018 (Munich Security Report 2018, To the Brink- and Back?, 2018). The report included a hypothetic scenario illustrating that if all EU-28 states and Norway spent 2% on defence, it would generate an additional $ 114 bn resource per year. Within that amount, $ 22 bn would go to the equipment costs if 20% guideline were to be met. However the report argues that this additional resources would make no meaningful change in short and medium terms if the resources were to be spent within existing mechanisms and structures (Munich Security Report 2018, To the Brink- and Back?, 2018).
6. Conclusions and Recommendations
Defence expenditures of NATO members started to decrease in the last year of the Cold War. This decline became more evident and constant after the collapse of the Berlin Wall. Recent developments showed more clearly that defence expenditure is responsive to crises / threats and proximity to them. Understandably, NATO members located in the western neighbourhood of Russia are far more responsive to the threat than others while radical terrorism in the Middle East contributed to reversing the downward trend in defence spending. Still, defence expenditure of most NATO member states, most of whom are EU members is currently far from 2% guideline which was agreed by the Allies as early as 2006.
As of 2017, except Estonia, Greece, Poland and Romania, no EU member NATO nation came even close to the 2% guideline in defence spending. This is of particular concern for U.S. because It is the one who closes the gap. As NATO Secretary General put it on several occasions, after Brexit, 80% of NATO defence spending will be coming from non-EU Allies (Doorstep by NATO Secretary General Jens Stoltenberg at the Start of the European Union Foreign Affairs Council in Defence Format, 2017). Despite frustration among Its ranks, the U.S. remains committed to the Alliance and offers its unconditional support to the Allies.
Germany’s choices on defence spending are of particular importance since It is the locomotive of EU and a decisive player in continental Europe. Having recognized the necessity of increasing the defence expenditure, Germany questions the efficiency of existing guidelines and tries to find wiser ways to spend the expected defence budget.
NATO, by far the most reliable politico-military organisation, has proved its utility in defending Europe in the most cost-effective way against any threat since its establishment. Europe doesn’t have any alternative for NATO in the foreseeable future. This makes NATO as the most useful tool for Europe to cope with the existing risks and threats.
Even though reduced defence expenditures were justified upon collapse of the USSR, the global security landscape has changed immensely since then, stipulating the otherwise. Latest figures published by NATO show an upwards trend in almost all metrics. Despite lack of clarity and inherent weaknesses in measurement, 2%-20% guidelines can be seen as an avenue to develop missing defence capabilities. Checks and balances within NATO decision-making mechanisms minimize the risks of unexpected consequences for each player. Besides, top NATO officials play a crucial role in finding common ground between different parties and keeping Allies focused on fair burden sharing. While doing so, they continuously express the need for complementarity between NATO and EU efforts on European Defence.
Considering all reasons mentioned above, EU Allies are not ready to conform to the guidelines with no plan about where this will take them. U.S. on the other hand wants to see more European willingness to take on more burden for their own defence. All parties have valid arguments from their perspectives. What is essential for the time being is to sit around a table and find common ground. At the end of the day, all members tend to adjust their operational contributions based upon the operation’s significance with regard to their national interests (McQuilton, 2015). Among those interests, Alliance solidarity and cohesion which provides deterrence might be the most valuable one.
Bibliography
De Luce, D., Gramer, R., & Tamkin, E. (2018, January 29). Trump’s Shadow Hangs Over NATO.Retrieved from Foreign Policy: http://foreignpolicy.com/
Defence Expenditure of NATO Countries (2010-2017). (2018, March 15). Retrieved from North Atlantic Treaty Organization: https://www.nato.int/
Doorstep by NATO Secretary General Jens Stoltenberg at the Start of the European Union Foreign Affairs Council in Defence Format. (2017, November 13). Retrieved from North Atlantic Treaty Organisation: https://www.nato.int/
Erlanger, S. (2018, February 18). U.S. Revives Concerns About European Defense Plans, Rattling NATO Allies. Retrieved from The New York Times: https://www.nytimes.com/
European Defence Report. (2017). Retrieved from Munich Security Conference: https://www.securityconference.de/
Financial and Economic Data Relating to NATO Defence. (1988, December 01). Retrieved from North Atlantic Treaty Organization: https://www.nato.int/
Funding NATO. (2017, June 02). Retrieved from North Atlantic Treaty Organization: https://www.nato.int/
Gupta, S., Clements, B., Bhattacharya, R., & Chakravarti, S. (2002, December). The Elusive Peace Dividend. Retrieved from International Monetary Fund: http://www.imf.org/
Hillison, J. R. (2014). Stepping Up: Burden Sharing by NATO’s Newest Members. Carlisle, PA: Strategic Studies Institute, US Army War College.
House Armed Services Committee Hearing on Security Challenges in Europe. (2018, March 16). Retrieved from EUCOM: https://www.eucom.mil/
International Security Assistance Force (ISAF): Key Facts and Figures. (2012, January 6). Retrieved from North Atlantic Treaty Organization: https://www.nato.int/
Joint Press Statements . (2017, February 15). Retrieved from North Atlantic Treaty Organisation: https://www.nato.int/
McCurry, J. (2016, July 21). Trump says U.S. May Not Automatically Defend NATO Allies under Attack. Retrieved from The Guardian: https://www.theguardian.com/
McQuilton, M. P. (2015). Fair Share or Freeride: Burden Sharing in Post-Cold War NATO. Fort Leavenworth, Kansas: United States Army Command and General Staff College.
Military Expenditure (% of GDP). (2018, 04 12). Retrieved from The World Bank: https://data.worldbank.org/
Munich Security Report 2018, To the Brink- and Back? (2018). Retrieved from Munich Security Conference: https://www.securityconference.de/
(2017). National Security Strategy of the United States of America. Washington D.C.
NATO Deputy Secretary General Discusses Transatlantic Partnership at Brussels Forum. (2018, March 8). Retrieved from North Atlantic Treaty Organization: https://www.nato.int/
Pellerin, C. (2017, June 01). 2018 Budget Request for European Reassurance Initiative Grows to $4.7 Billion. Retrieved from U.S. Department of Defence: https://www.defense.gov/
Press Briefing by NATO Spokesman, James Appathurai after the Meeting of the North Atlantic Council at the Level of Defence Ministers. (2006, June 8). Retrieved from Defence Ministers Meetings: https://www.nato.int/
Resolute Support Mission (RSM): Key Facts and Figures. (2015, May). Retrieved from North Atlantic Treaty Organization: https://www.nato.int/
SIPRI Military Expenditure Database. (n.d.). Retrieved from SIPRI: https://www.sipri.org/
Techau, J. (2015). The Politics of 2 Percent, NATO and the Security Vacuum in Europe. Washington: Carnegie Endowment for International Peace.
(2018). The Secretary General’s Annual Report 2017. Brussels: North Atlantic Treaty Organisation.
(1990). US – NATO Burden Sharing: Allies’ Contributions to Common Defence During the 1980s.Washington D.C.: United States General Accounting Office.
US Request for NATO Spending Boost ‘a Fair Demand,’ German Defense Minister Says. (2017, February 10). Retrieved from Deutsche Welle: http://www.dw.com/
Wales Summit Declaration. (2014, 09 05). Retrieved from North Atlantic Treaty Organisation: https://www.nato.int/
(2016). White Paper 2016 on German Security Policy and the Future of the Bundeswehr. Berlin: The German Federal Government.
Wintour, P., Harding, L., & Borger, J. (2016, October 24). Cold War 2.0: How Russia and the West Reheated a Historic Struggle. Retrieved from The Guardian: https://www.theguardian.com/
- Footnotes like the following appeared in official NATO papers till 1990: “In addition to defence expenditures (NATO definition), the German authorities are obliged to incur large expenditures for Berlin owing to the exceptional situation of this city and the need in the interest of the free world to ensure its viability. These expenditures, which are not included in the figures given above since they do not come within the NATO definition” (Financial and Economic Data Relating to NATO Defence, 1988). ↑
- For a clear and comprehensive definiton of “defence expenditure” and “equipment expenditure” reader may refer to (Defence Expenditure of NATO Countries (2010-2017), 2018).